Fortunately, "down" on the Earth's surface these variations are rather weak. But they can have a considerable effect on the distribution of electrically charged molecules in the upper atmosphere (ionosphere); the term magnetic storm illustrates this quite well. This again heavily influences the propagation of radio signals in the long-, medium- and shortwave range and lets aurora (polar lights) show up which are detectable on the radio long before they are visible by eye.
This magnetogram is produced by our own fluxgate-magnetometer which is located at the beacon site.
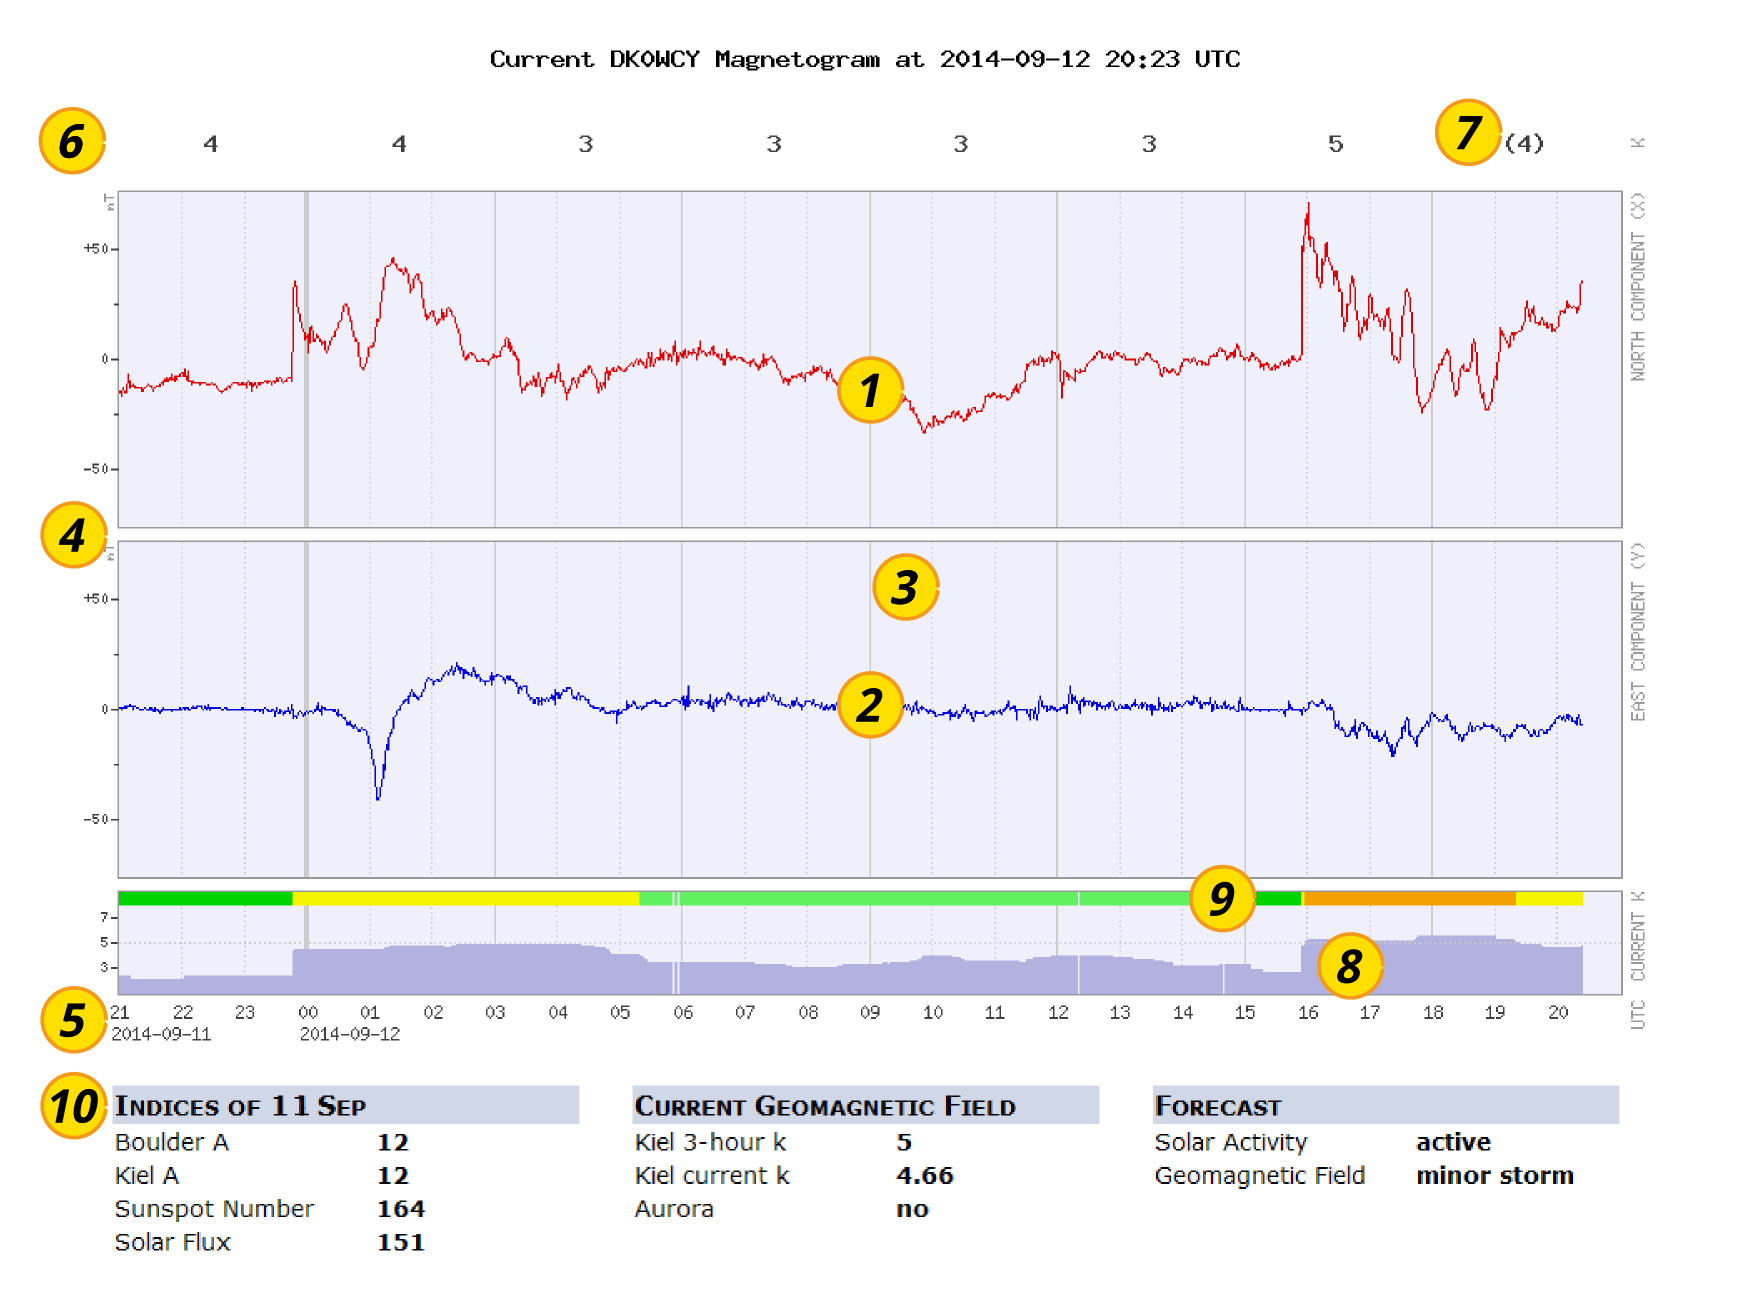
A magnetic field has three components corresponding to the axes in a three dimensional space. Upon international agreement the horizontal component towards North is termed X (1) and the horizontal component towards East is called Y (2). Vertical component Z (towards Earth's center) is not measured here because its influence on radio propagation is marginal.
On Earth's surface the absolute intensity (magnetic flux) of the geomagnetic field is just under 50,000 nT (nanotesla). But the variations we measure merely range from a few nT when conditions are calm up to 1000 nT during extreme magnetic storms. Small variations would be invisible on this scale, therefore the magnetogram uses three different scales identified by the background color (3): A blueish background is used for quiet to unsettled conditions, upon greater variations it changes to yellow and during strong magnetic storms it turns into red. The scale on the vertical axis (4) which shows the intensity variation in nT changes accordingly.
The magnetogram runs over the most recent 24 hours, the time axis marks are hours in UTC (former Greenwich Mean Time).
In order to get a measurement reading for the unrest of the geomagnetic field the maximum variation in one of the components during 3 hours is determined and converted into a value between 0 (extremely quiet) to 9 (heavily disturbed); this is the k index. It is displayed on the top for each three hour period (6). For the current period we can just say what k index would result if no stronger variations happen until the period ends. Therefore this value is displayed in brackets and termed next expected k (7).
Because the k index is determined not more often than once in three hours it could take that long until a magnetic disturbance is visible in this value. At DK0WCY we therefore calculate an additional value current k. This is the k index of the very last 180 minutes, not bound to the fixed three hour periods of the k index. Current k promptly reacts if a change in intensity occurs and is displayed by the "mountain graph" (8).
The color bar right above (9) offers a quick overview of the development of the magnetic unrest: Green marks quiet magnetic conditions (k=0 to 3), yellow means unsettled conditions (k=4), orange is a minor magnetic storm (k=5) and increasingly stronger magnetic storms are expressed by red and violet colors.
At the bottom you see some more data which are relevant to radio propagation (10). The left column shows data from the past day, the center column has information on the current state and the right column contains a forecast for the next day. Data in left and right columns are courtesy of the NOAA Space Weather Prediction Center in Boulder (USA).